Profiling
Profiling offers a deeper level of visibility on top of traditional tracing, removing the need for custom instrumentation and enabling precise code-level visibility into your application in a production environment.
Sentry’s Profiling products provide precise, code-level visibility into application execution in a production environment. Profiling provides context at a deeper level than traditional tracing, enabling you to visualize call stacks on every thread without the need for custom instrumentation. With Profiling you can quickly identify hot paths in your code and understand potential performance bottlenecks, enabling you to build in performance as a feature from day one.
Sentry supports profiling for both backend and frontend use cases with two products:
- Continuous Profiling enables continuously profiling backend services to find code paths that are causing excessive resource usage and high infrastructure cost.
- UI Profiling enables profiling critical user flows (or entire user sessions) in browser and mobile apps to find code paths that are causing janky scrolling and animations, high interaction latency, and slow load times that contribute to a poor user experience.
On the Profiling page, you’ll find high level metrics on the slowest functions in the selected project(s), as well as any functions that have regressed or improved in performance within the selected time range.
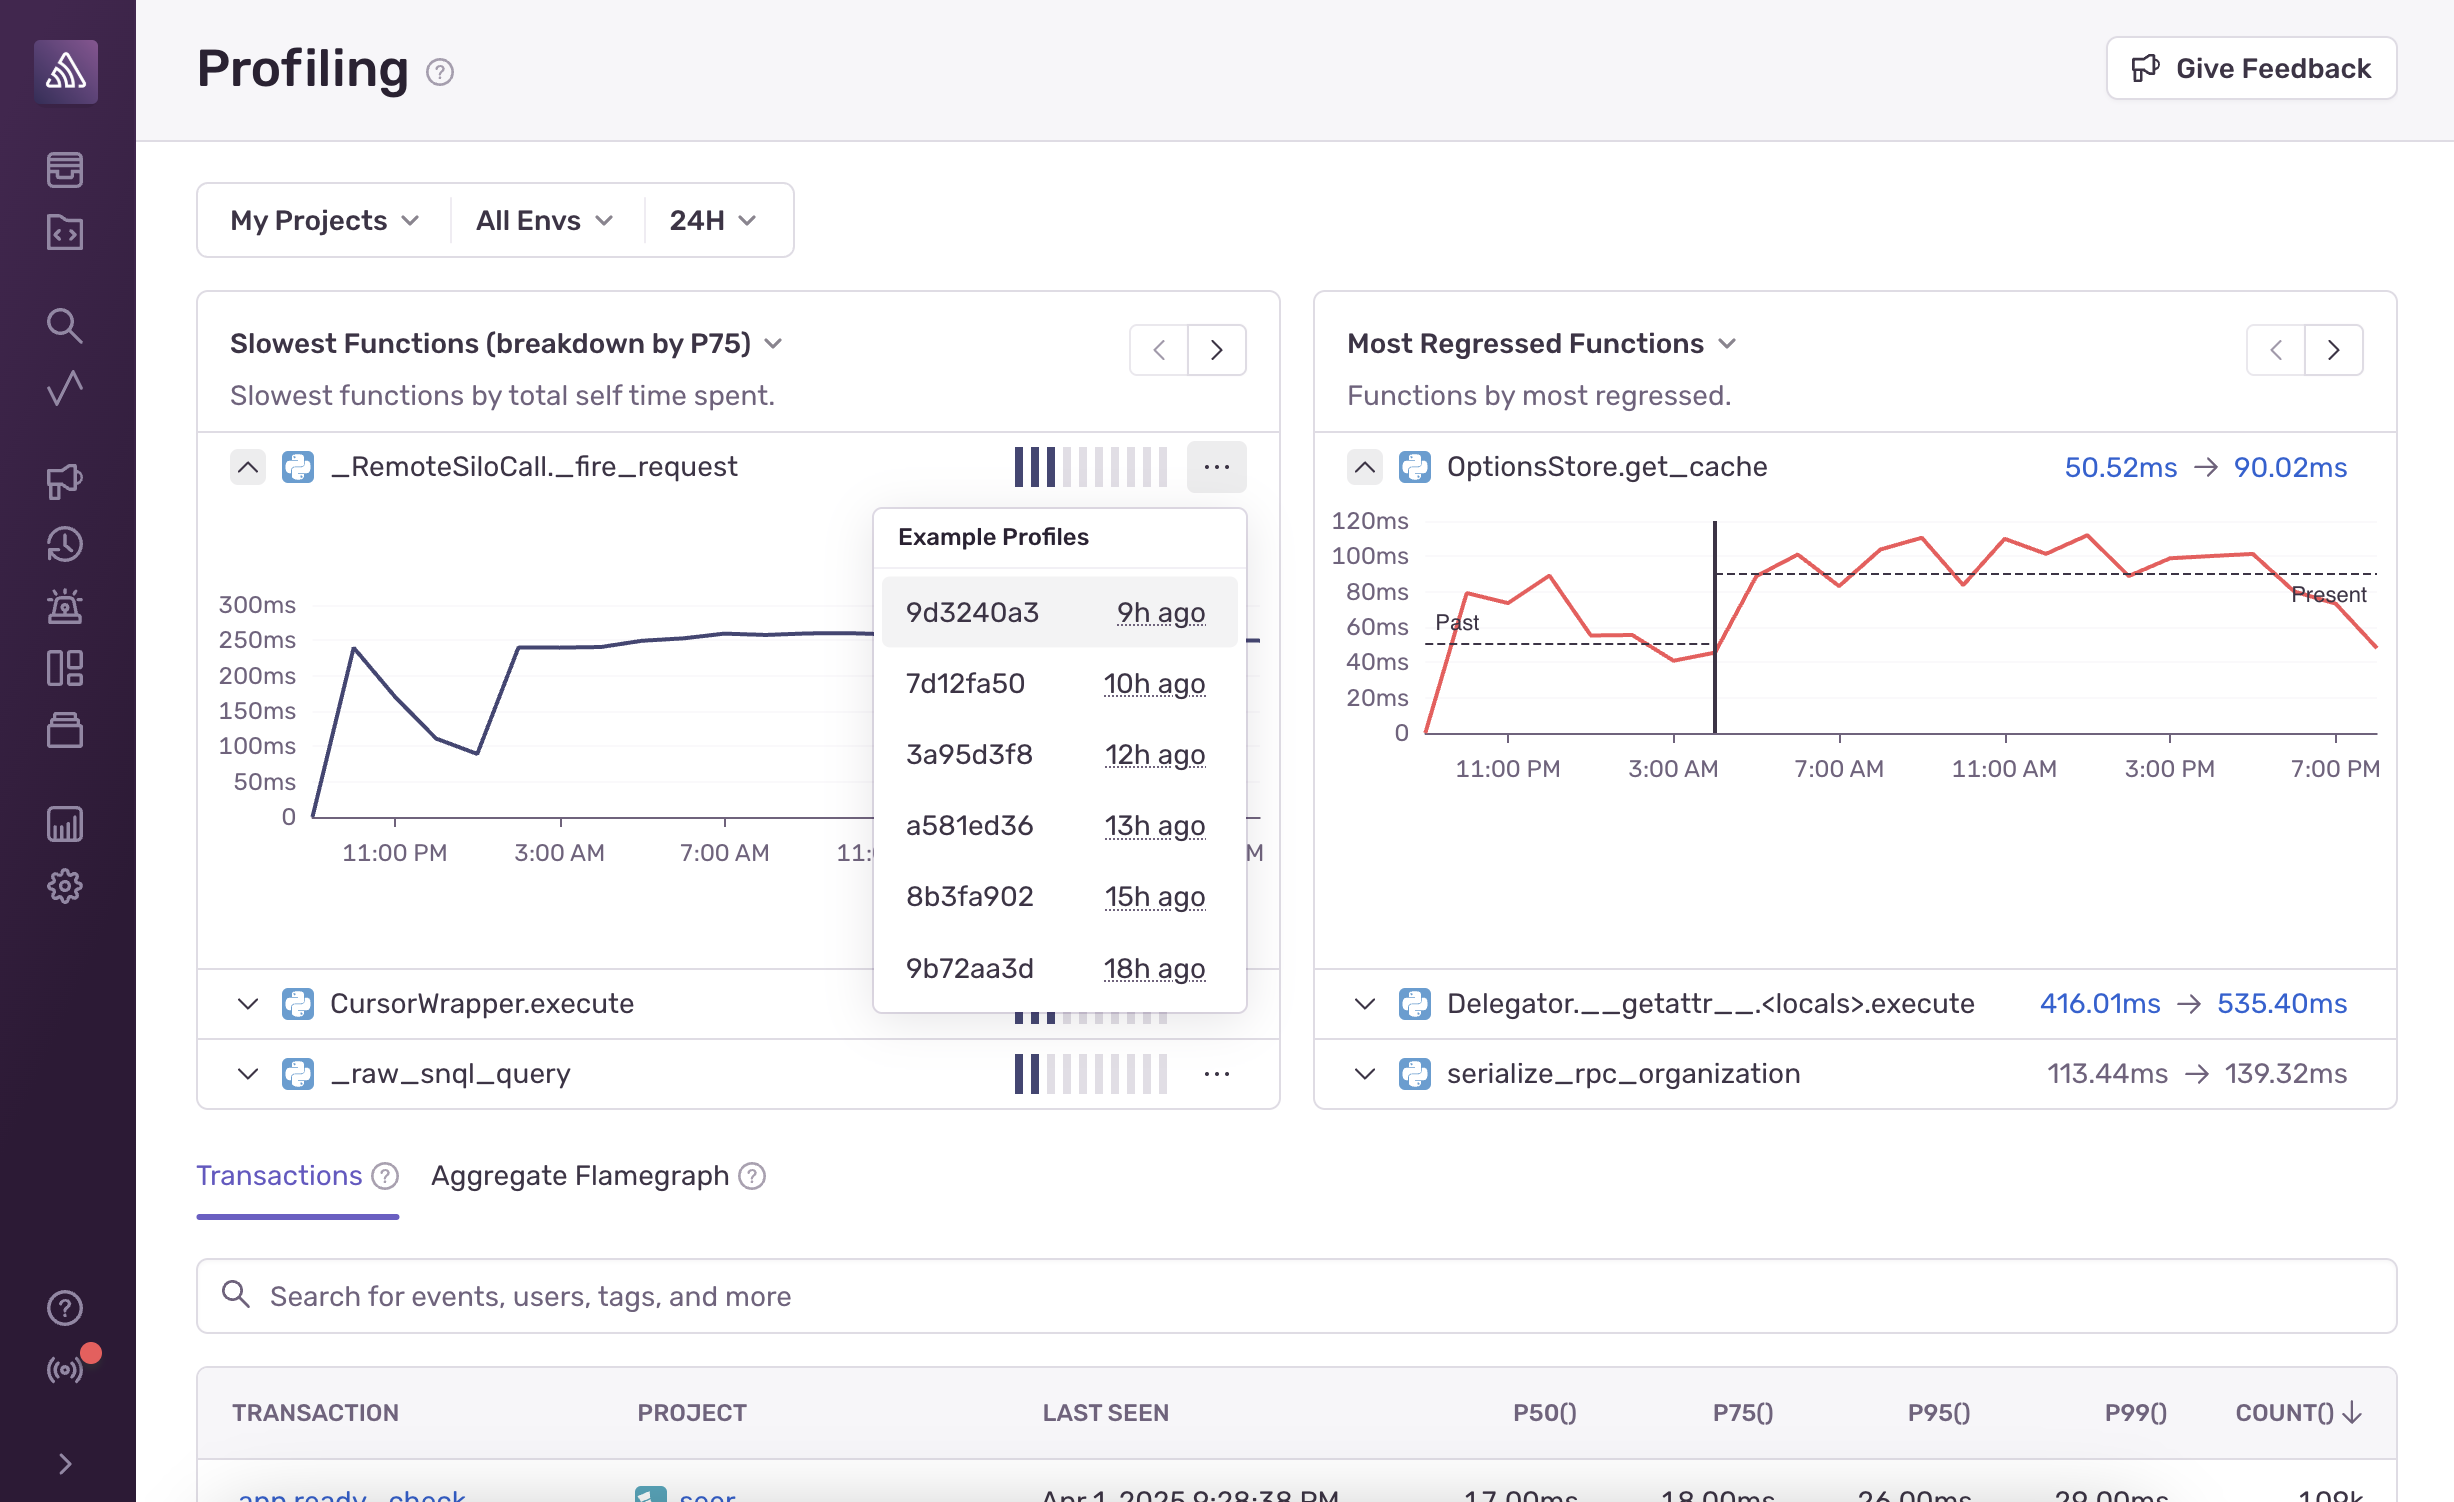
On the Slowest Functions widget, you can click on the ... button on each function to see a list of example profiles containing that function. On the Most Regressed/Improved Functions widget, you can click on the function duration before & after the change to see before & after example profiles containing that function.
Below the function metrics, you’ll find two tabs: Transactions and Aggregate Flamegraph.
If tracing is enabled, Transactions shows a list of all of the transactions instrumented in the selected projects, allowing you to break down profiling data by endpoints, routes, user flows, etc. It gives you a more focused view of application performance within a specific part of the application.
The Aggregate Flamegraph tab does not require tracing to be enabled, and will show you a high level view of all of the most frequent code paths within the selected projects. This gives you a more general view of where time is being spent overall in a service or application.
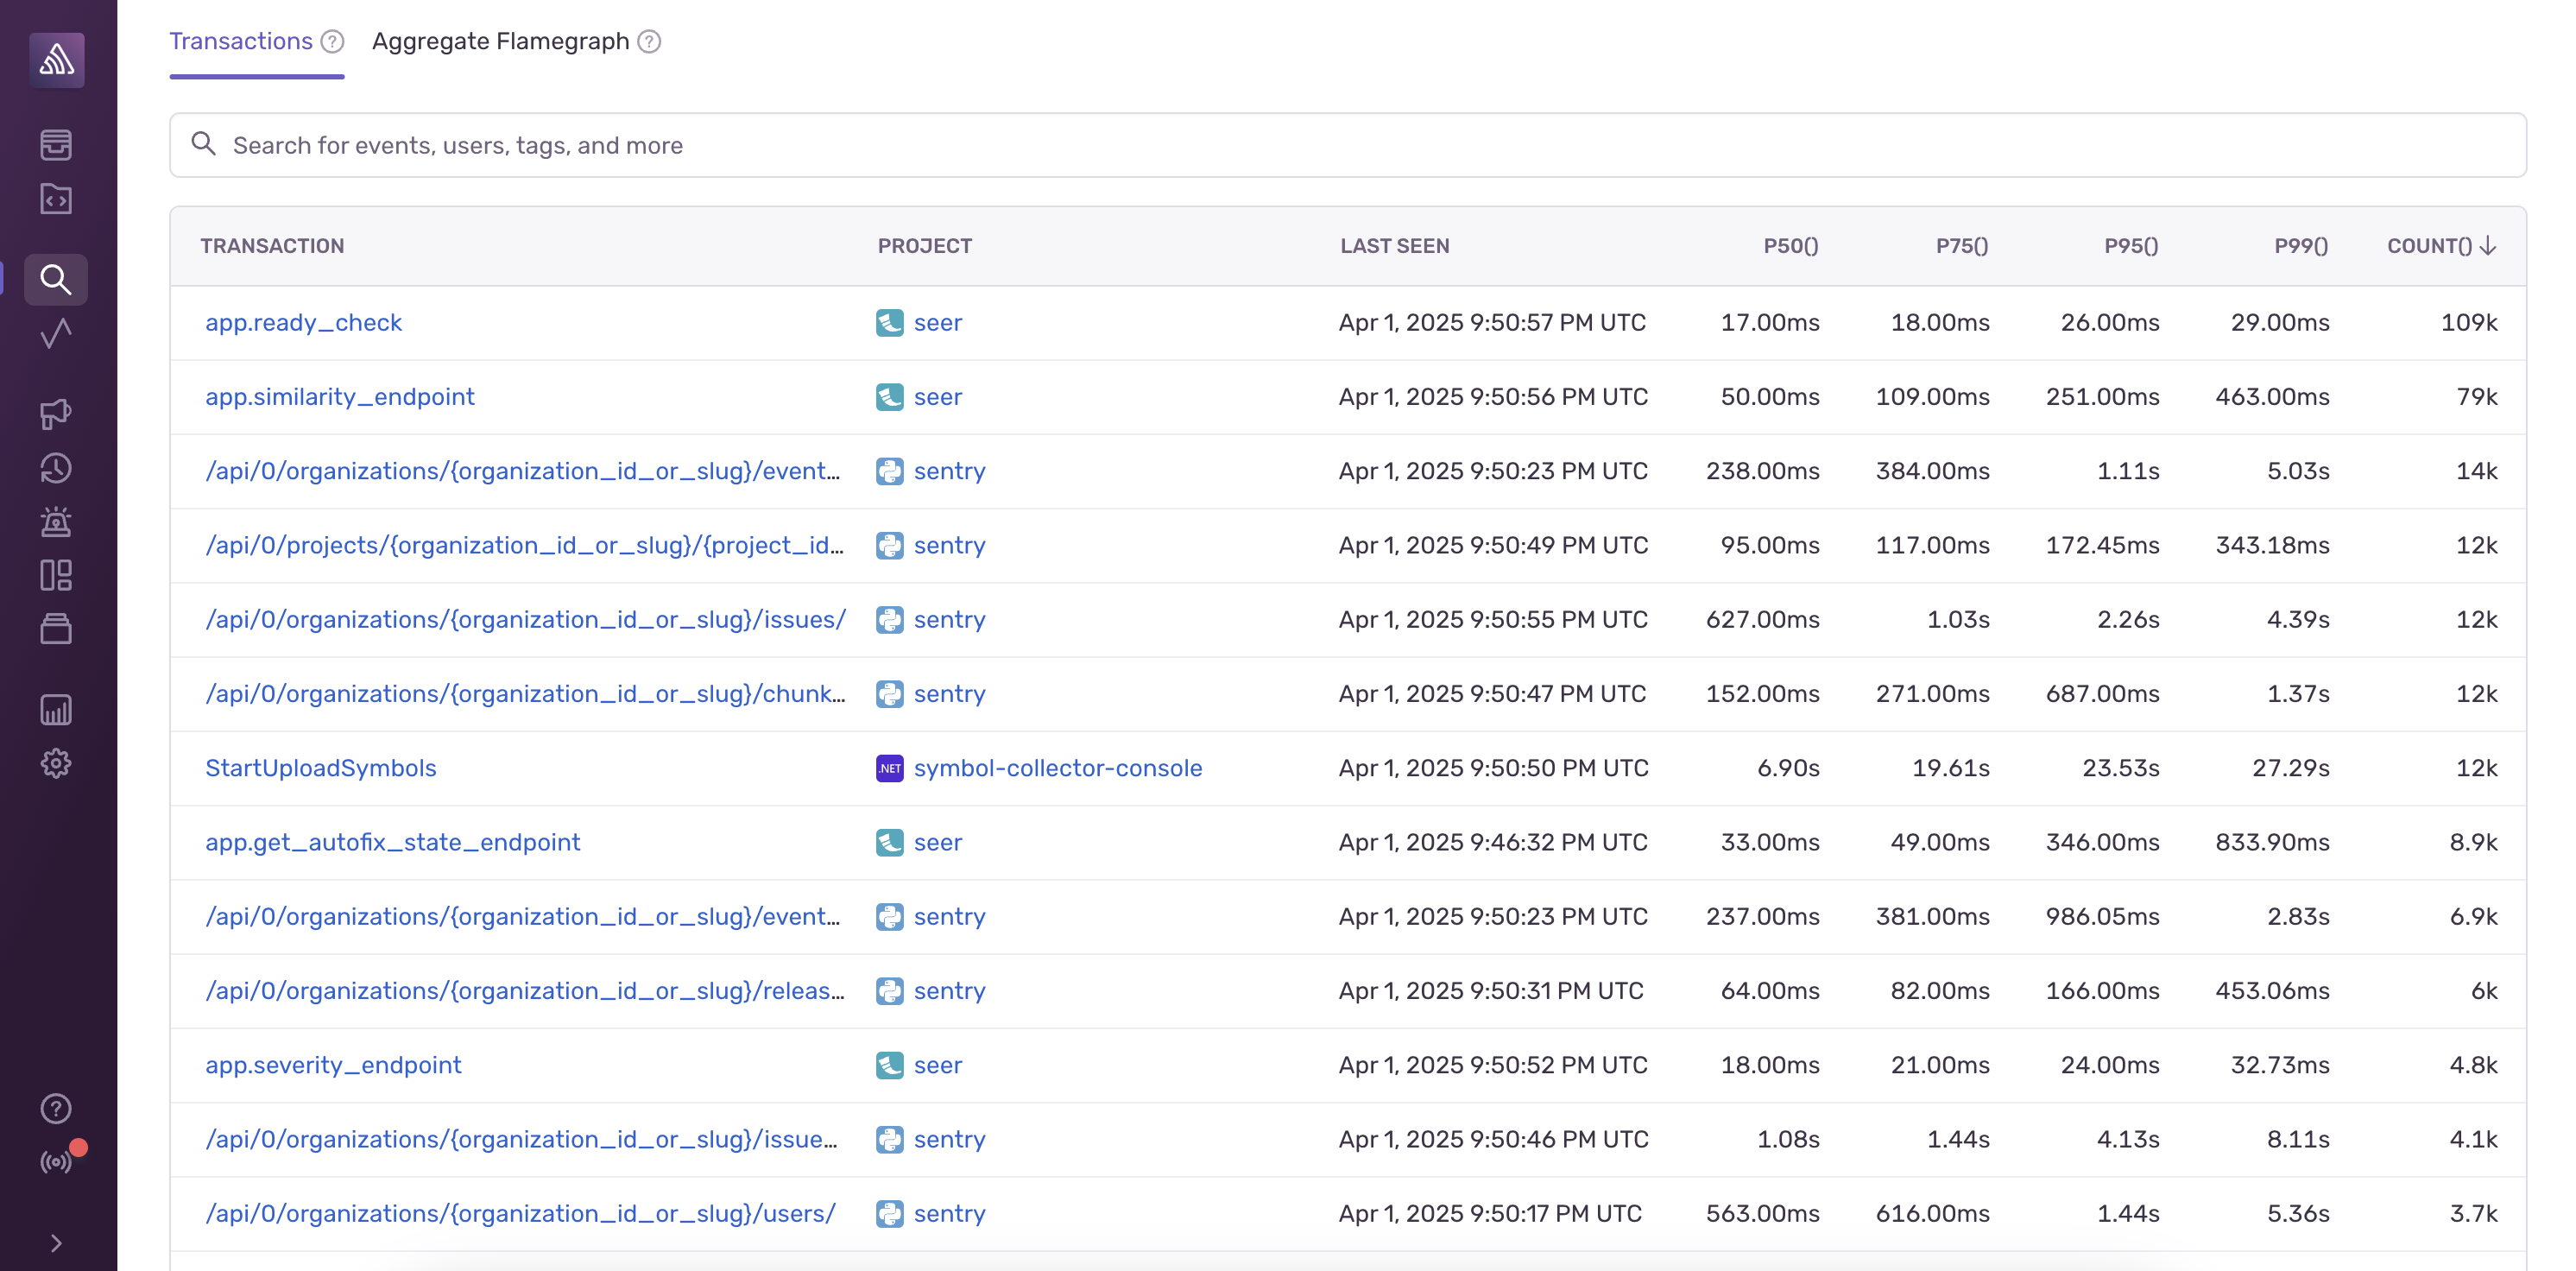
The transactions list will not be populated if tracing is not enabled for at least one of the selected projects.
The Transactions tab, by default, shows a list of all transactions in the selected projects sorted by the frequency (count) of the transaction. The list can also be sorted by duration (p50/75/90/95), project, timestamp, etc. by clicking on the column headers in the table. The transactions list can be filtered by specifying a query using the search bar. For example, you can search for transactions from specific users or transactions that are tagged with a custom attribute.
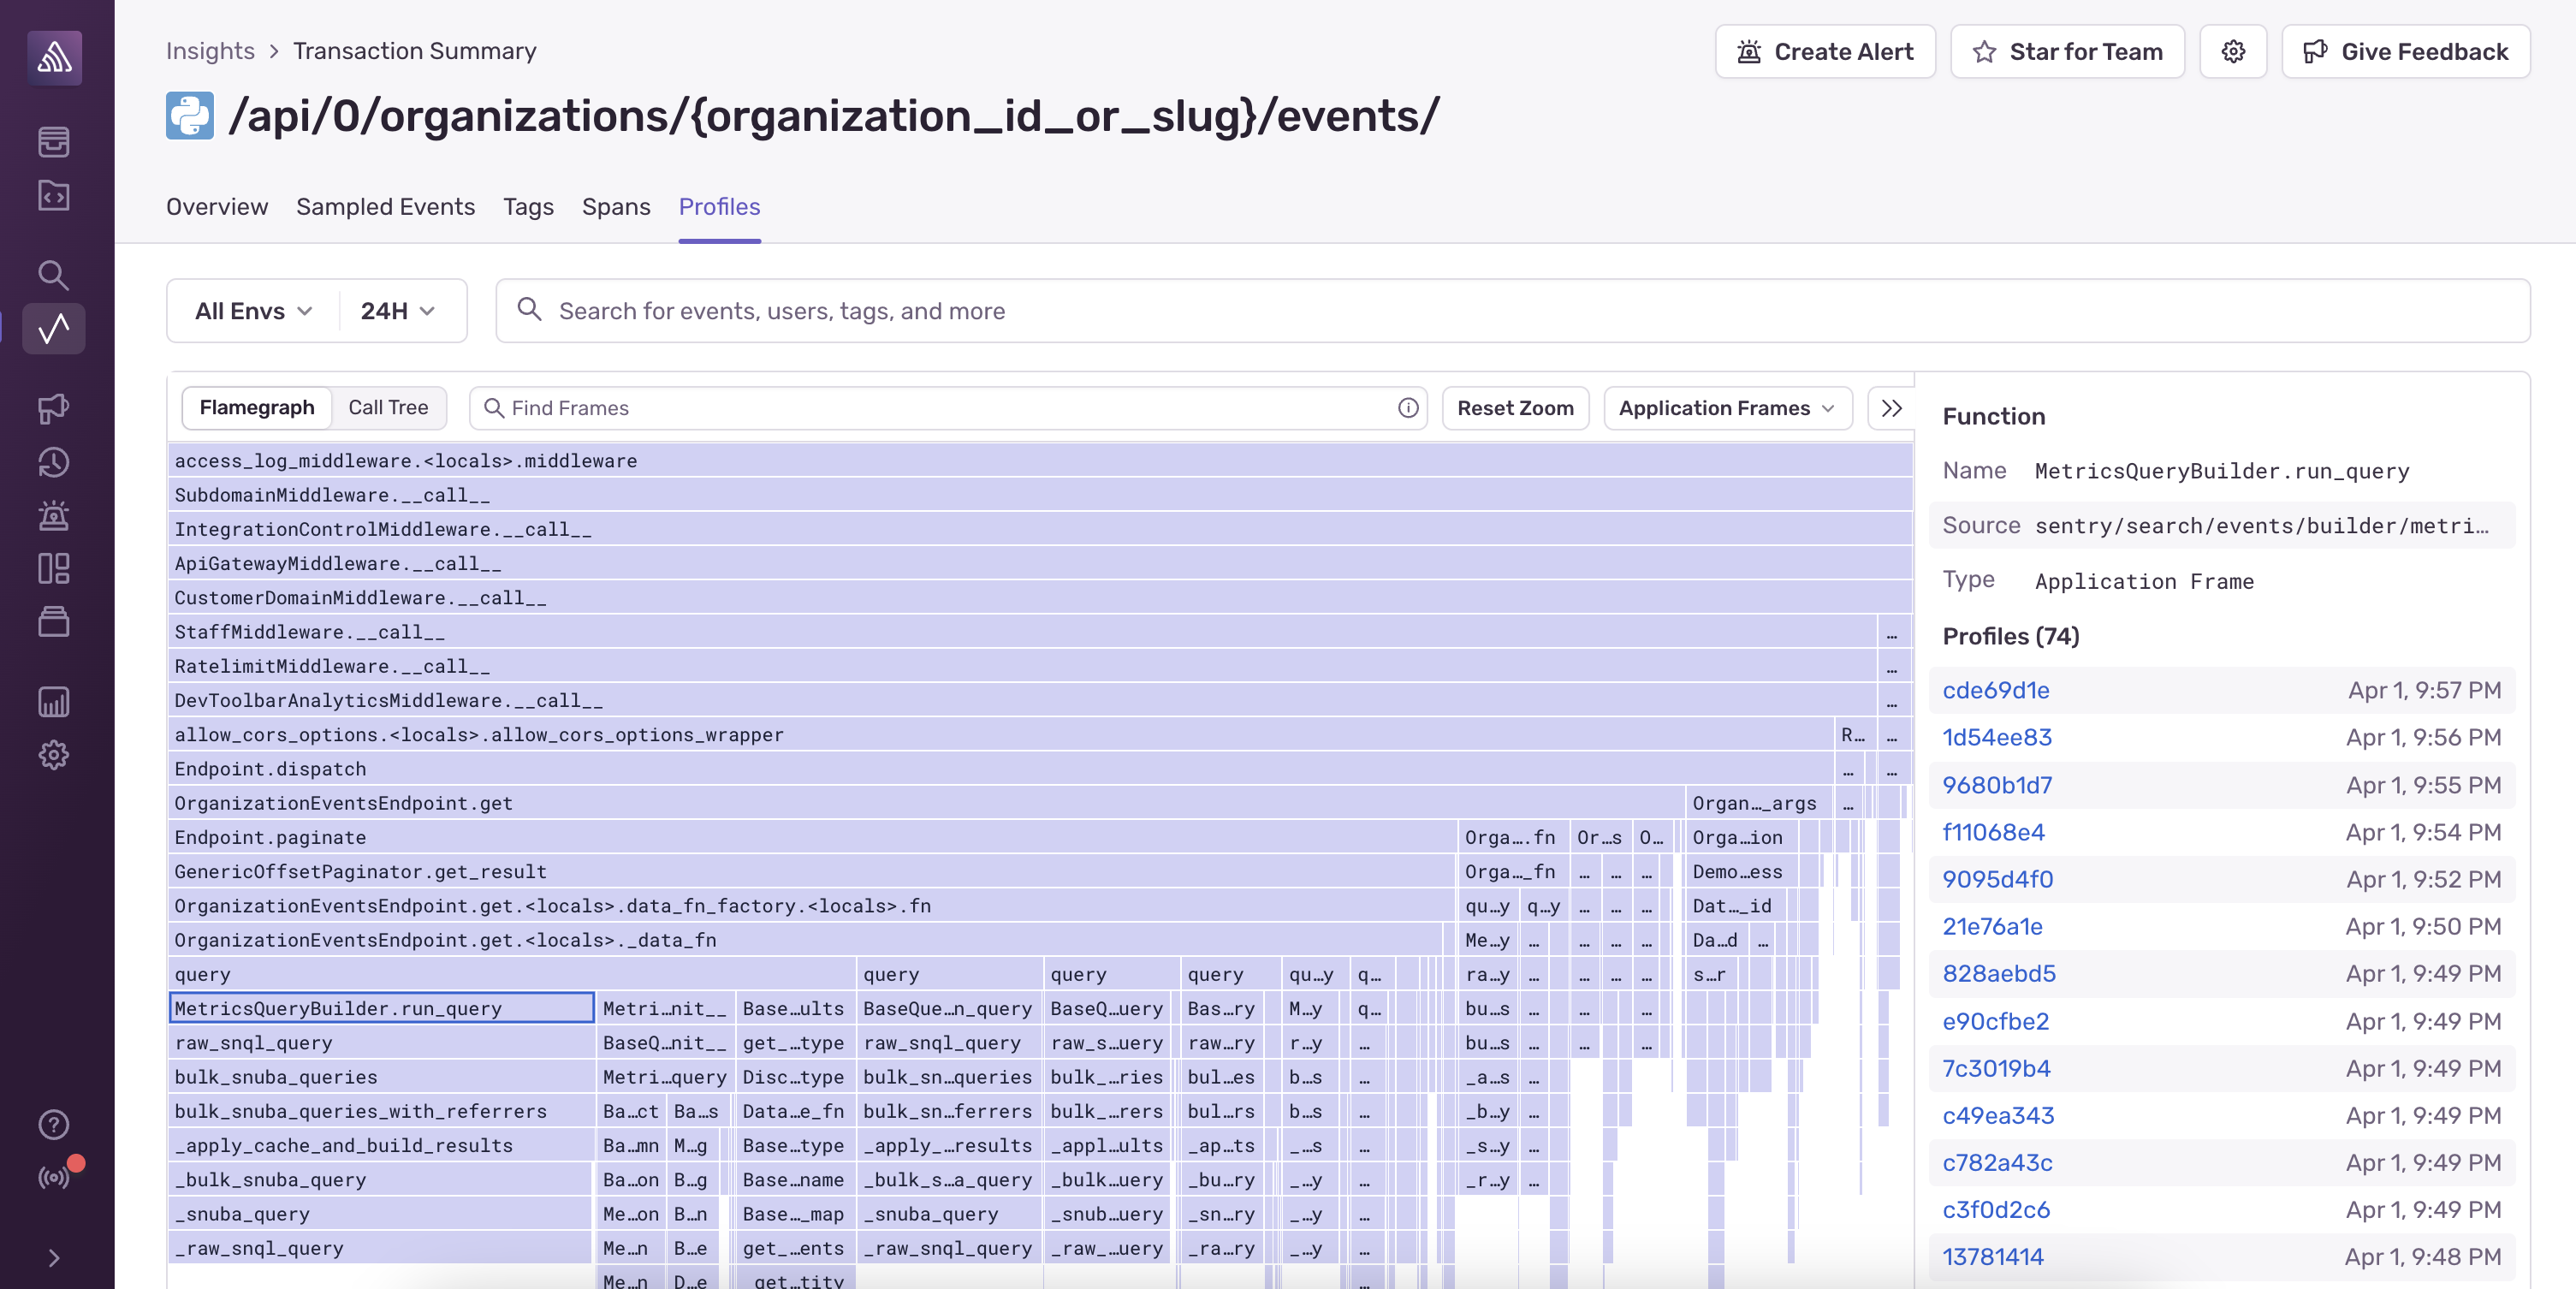
Click the name of a transaction to navigate to the Transaction Summary page, which contains aggregated performance data that is scoped to that transaction. By default, the Profiles tab is selected, which contains an aggregate flamegraph showing the most frequent code paths that were profiled within that transaction. This flamegraph behaves the same as the flamegraph in the Aggregate Flamegraph tab described below.
The Aggregate Flamegraph tab shows a flamegraph with aggregated information on the frequency of code paths within the selected projects.
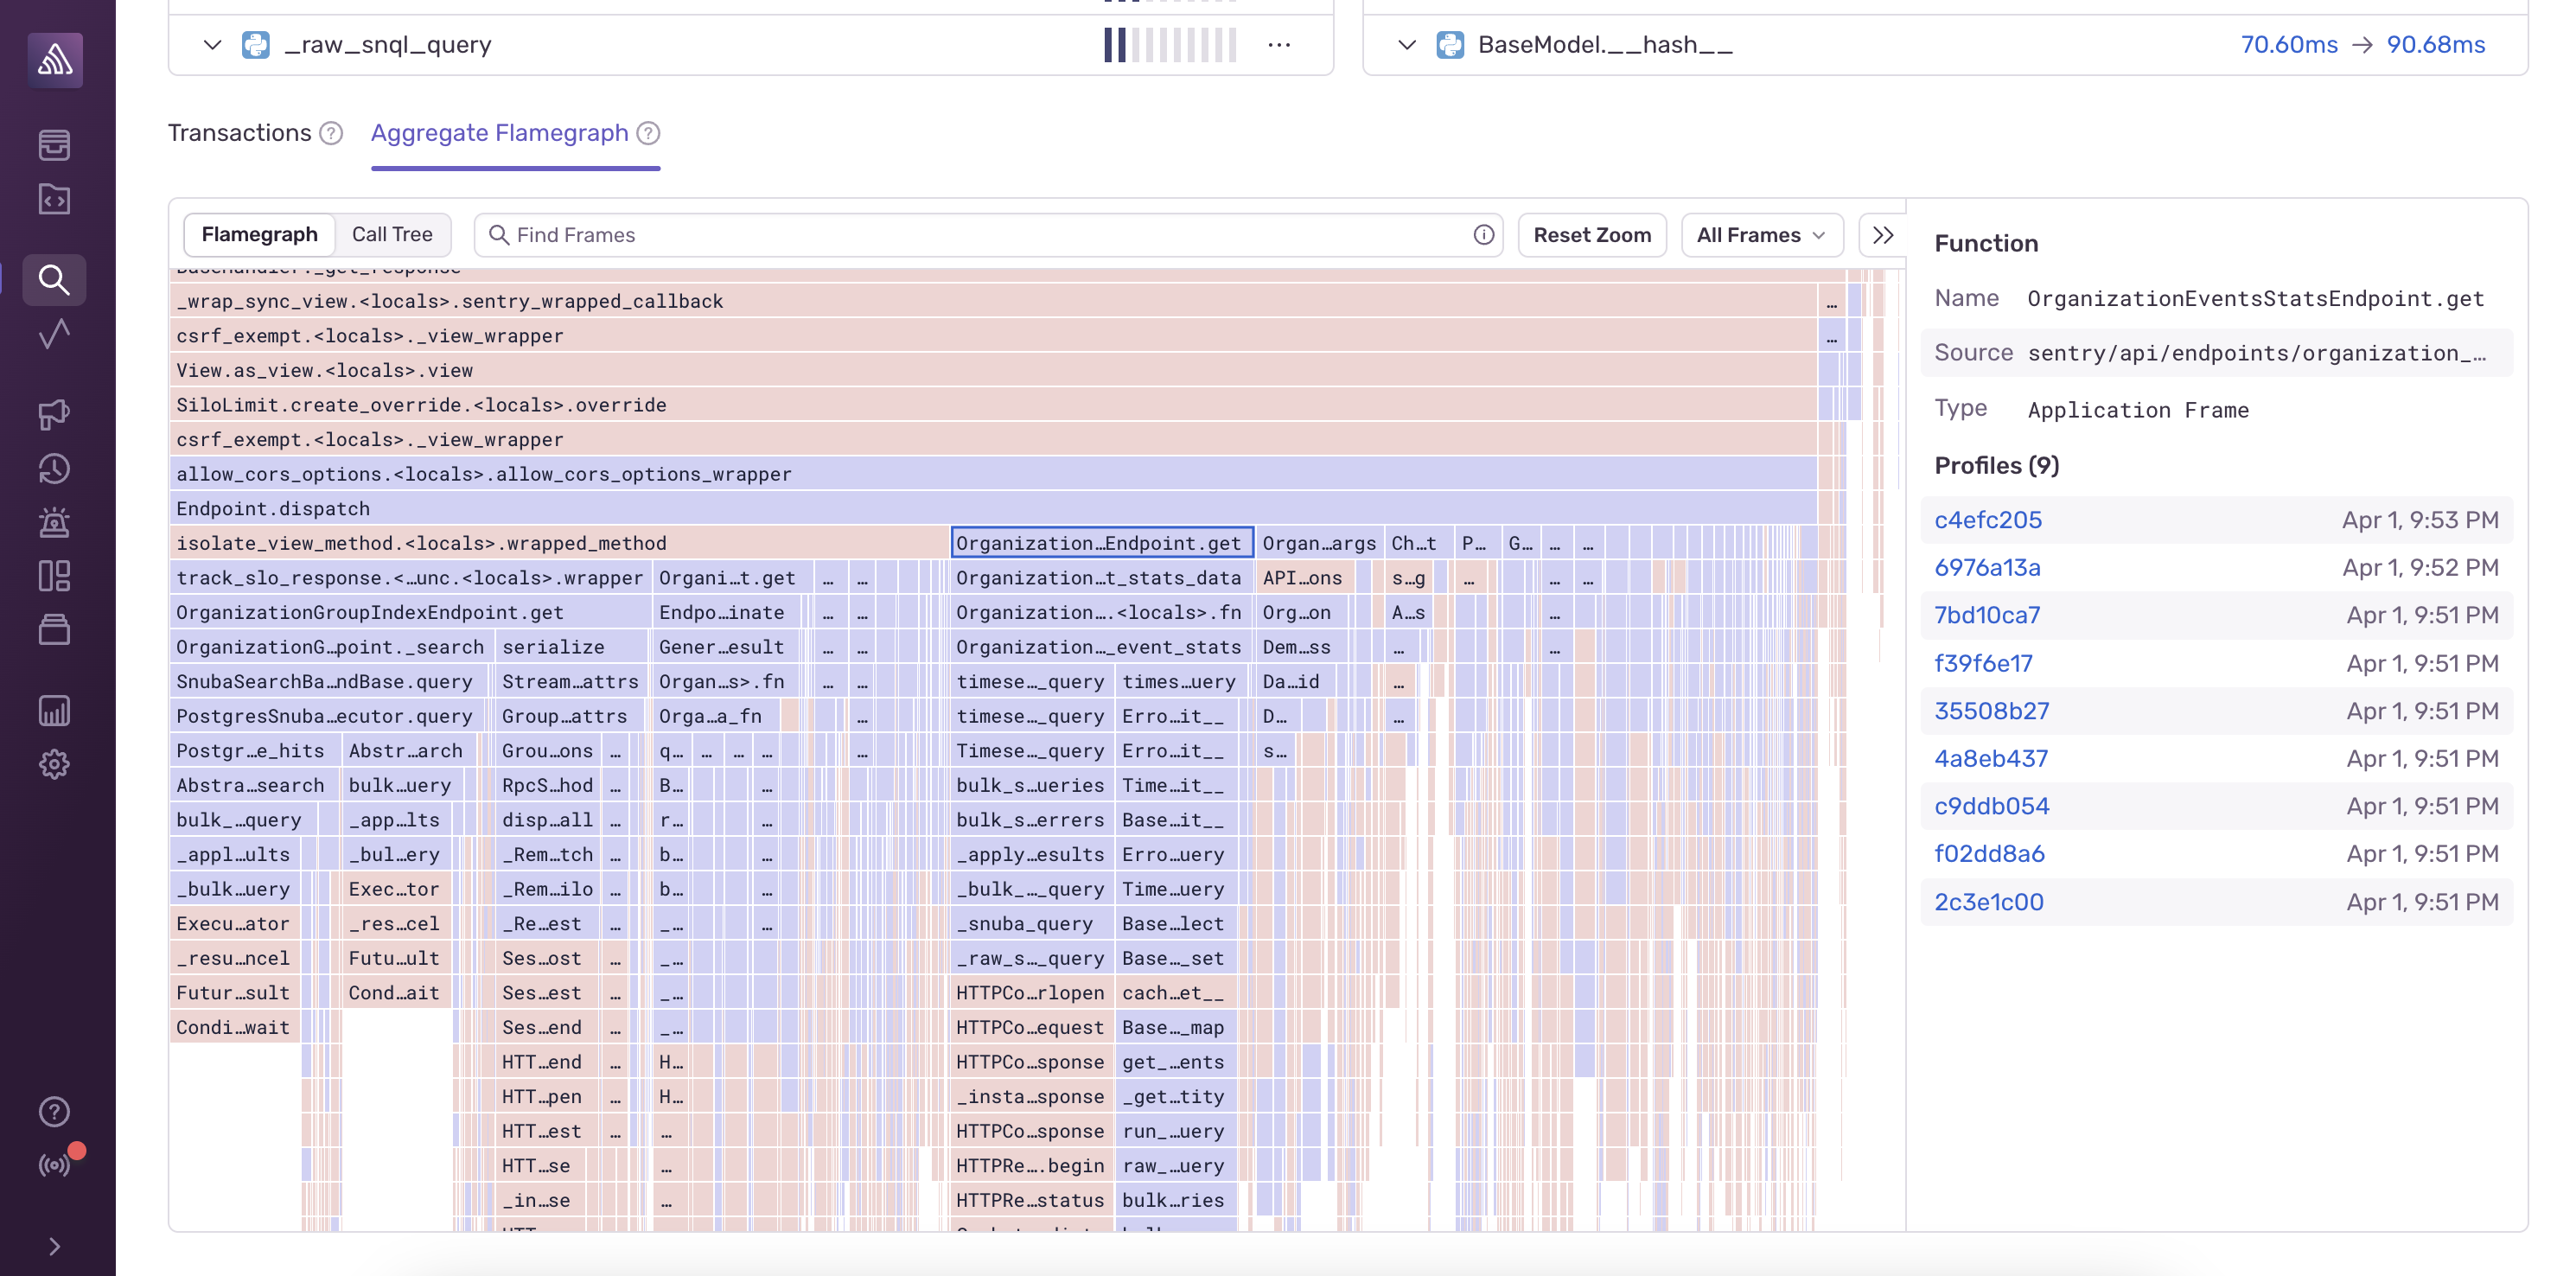
The wider frames represent more frequent code paths, which are likely more relevant optimization opportunities. You can click on a frame to select it, which will populate the sidebar on the right with links to example profiles containing the selected function.
If you are already looking at a trace and have insufficient information to debug the root cause of the problem, profiling data can help fill in the gaps. If there is profiling data associated with the trace, there are two ways to get to it from the Trace View.
One way is to select a span and scroll down to the Profile section of the span details:
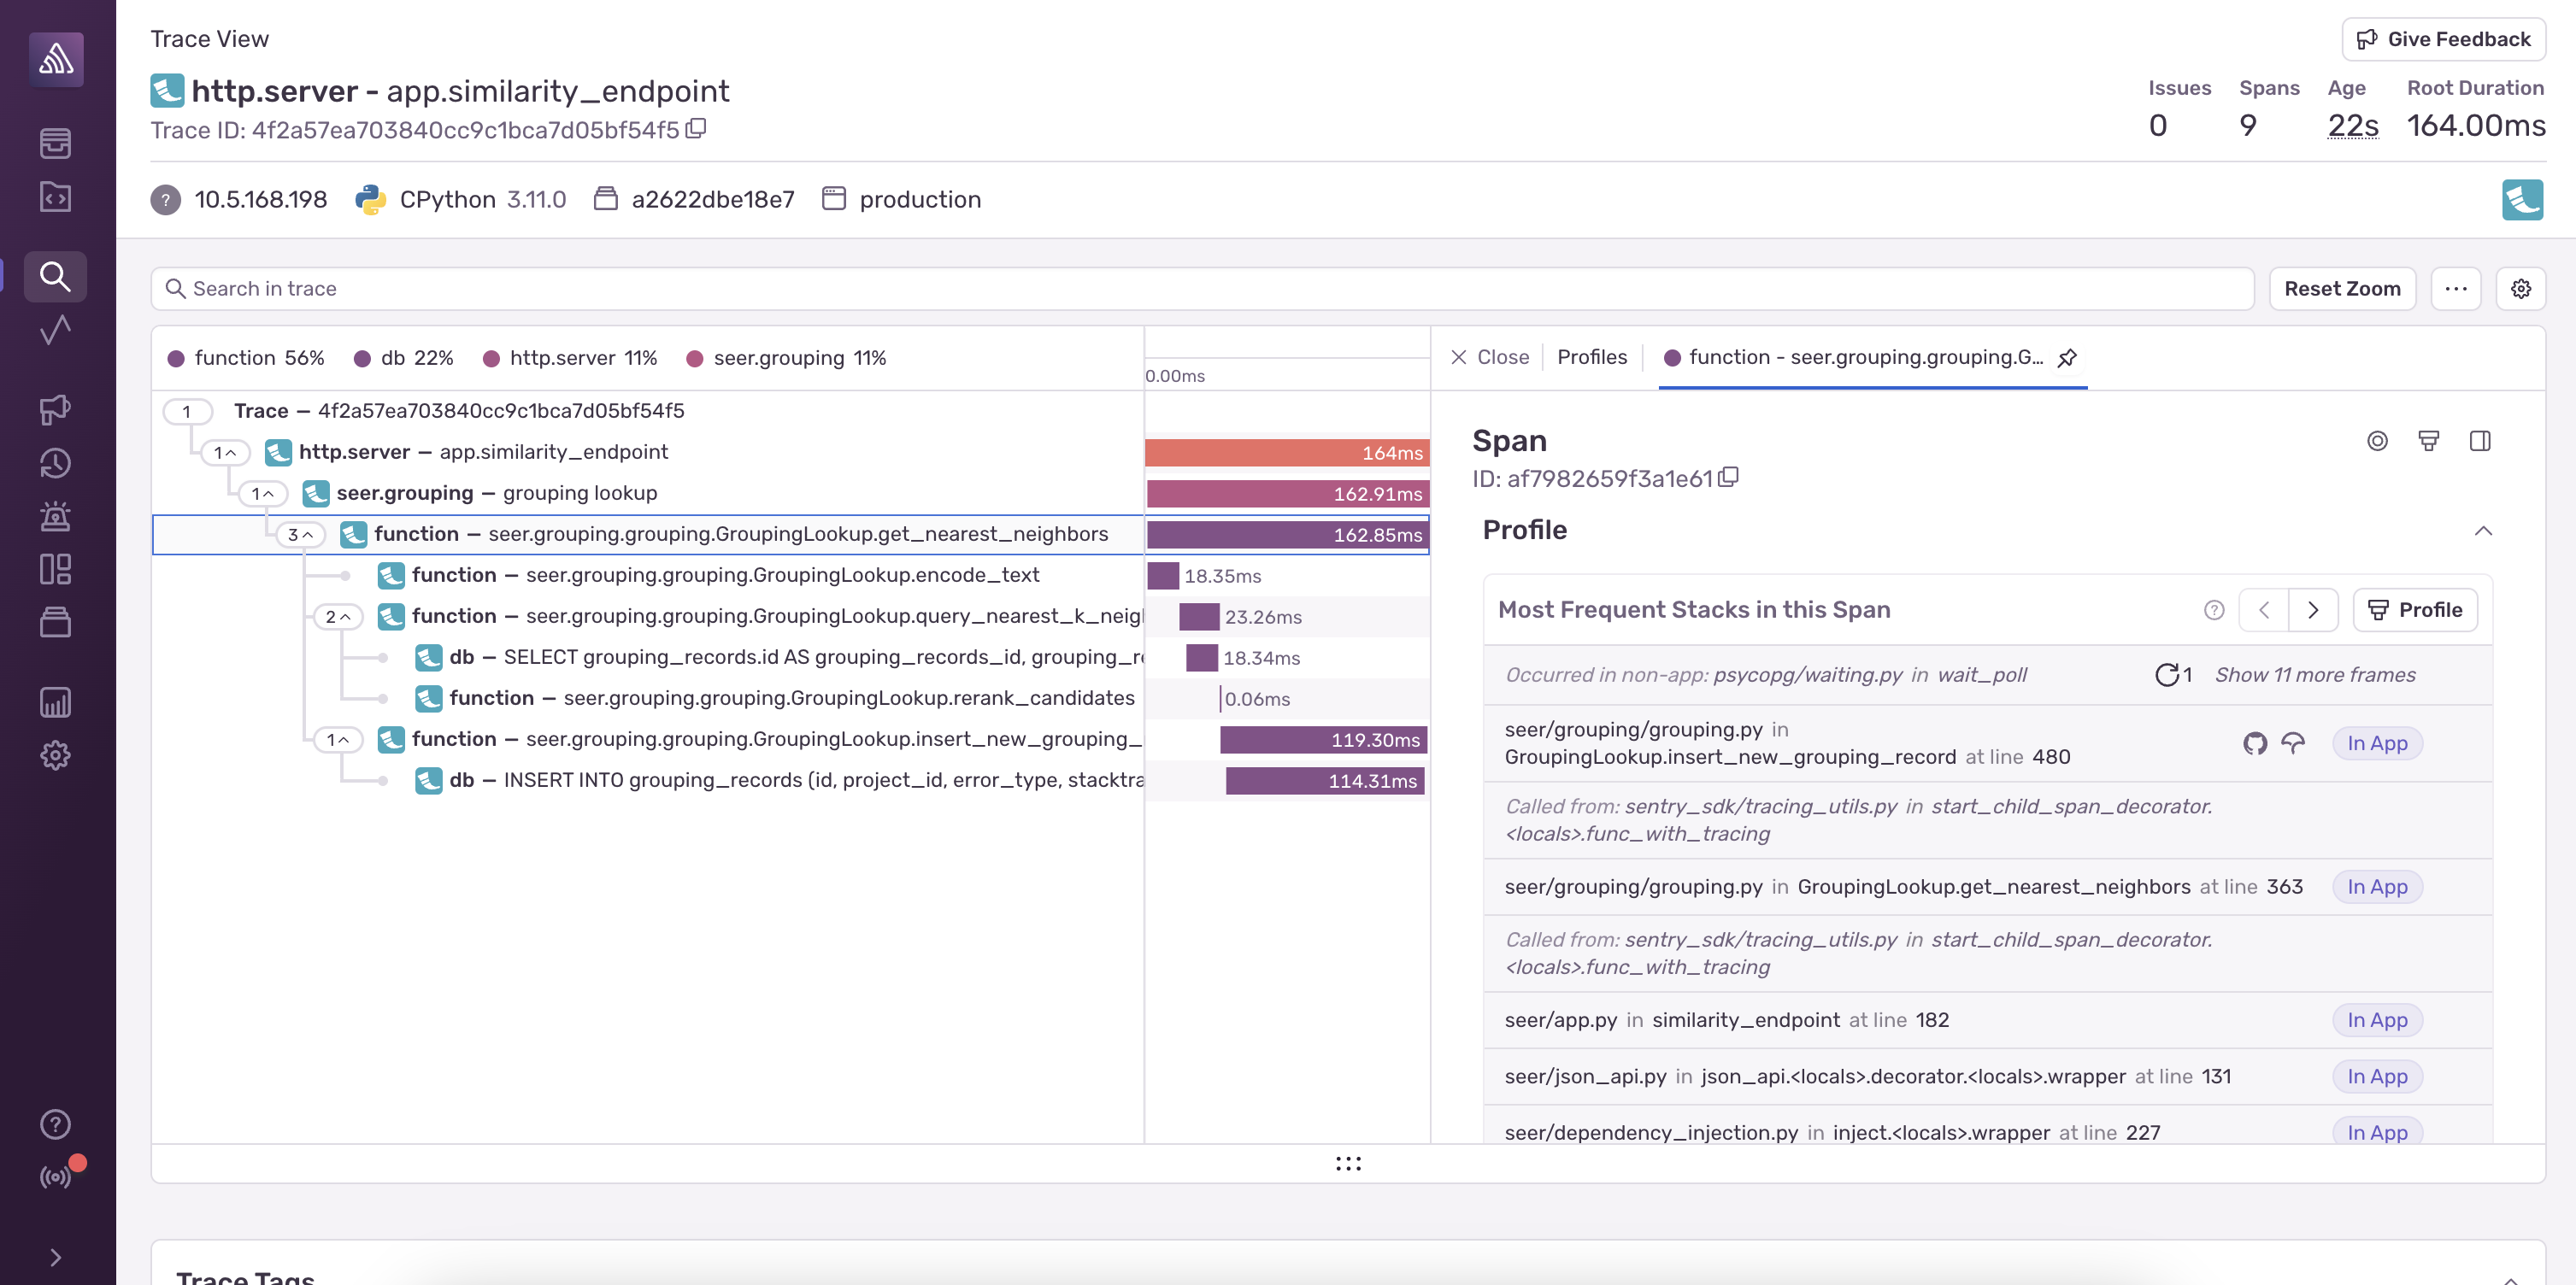
The Most Frequent Stacks in this Span widget shows a paginated list of call stacks in descending order of frequency that indicates where in the code most of the time in the selected span is spent. Click the > button to page through the other stacks, or click the Profile button to view the entire profile in the flamegraph viewer.
The other way is to click the Profiles tab in the Trace View, which will show a list a profile events across all spans contained within the trace:

Read the Getting Started guide to start using Continuous Profiling and UI Profiling.
Our documentation is open source and available on GitHub. Your contributions are welcome, whether fixing a typo (drat!) or suggesting an update ("yeah, this would be better").